Simulation of stochastic roofing using models from statistics Physics.
A short summary of a summer coding project I was Involved in.
Stochastic Lowner Evolutions (\(SLE_k\)) are a family of conformal maps \({g_t : t \geq 0}\) such that \(g\) satisfies the equation:
\begin{equation*}
\frac{\partial}{\partial t}g_t(z) = \frac{2}{g_t(z)-\sqrt{k}B_t}
\text{, where } k > 0\text{ is real, and }B_t \text{ is a standard Brownian motion on }\mathbb{R}
\end{equation*}
These curves are interesting as they arise in physics as 2D critical interfaces, in other words the
border between two different phases or domains.
A few important properties of SLEs defined in this way are:
- Scaling Property: If \(\alpha\) is a positive constant, the process \((t, z) \to \alpha^{-1/2}g_{\alpha t}(\sqrt \alpha z)\) has the same distribution as \((t, z) \to g_t(z)\)
- For all \(k \in [0,4]\) the trace of \(SLE_k\) is almost surely a simple path
- The path found in critical percolation is unique
- If you zoom in on the curve it will look the same, therefore there is no length scale that we need to account for
- The curve will never intersect with itself
- Given intitial conditions, the object is exists and doesn't lead to contradictions
Without going into details, the idea of this project was if we could use such curves as the structural beams.
In the same way bees use curves which give rise to hexagonal structures, could we use random curves to give rise to a family of structurally stable architectures?
This project uses Eigenvalue analysis to determine the strength of a particular structure.
The following was coded in Java, and later turned into an .exe and left to run.
It can be proven that a (\(SLE_k\)) where \(k=6\) curve can be generated as follows:
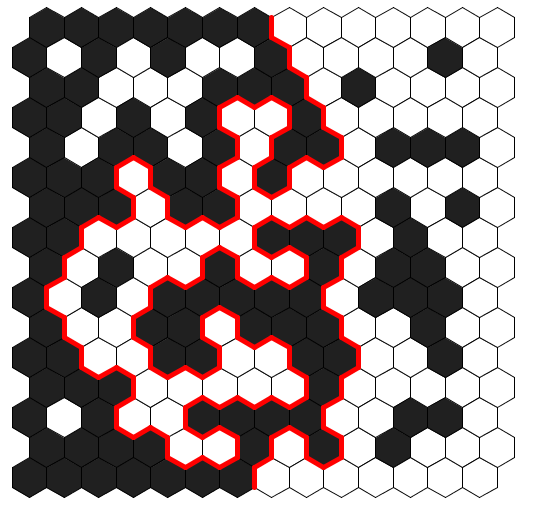
fill the space with hexagons colour each of them randomly either white or black, with the exception of
hexagons on the border. The border hexagons will be coloured black if they are on the left-side of the
space, and white if on the right-side. Next, we create a line to traverse along the edges of these hexagons,
starting at the edge where black and white meet, always keeping the black hexagons to the left, See Figure 1 below.
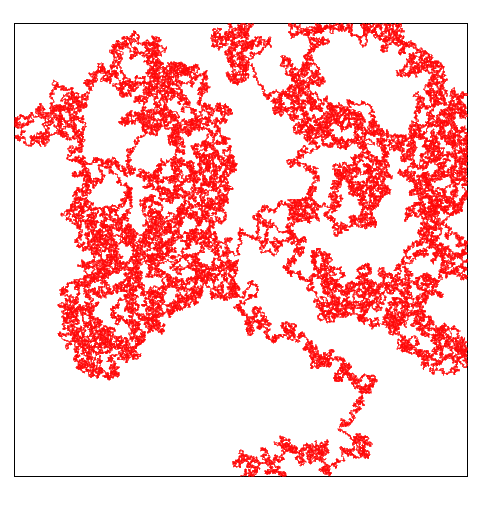
As these hexagons get smaller we converge to a (\(SLE_6\)) curve, see Figure 2.
A Java applet was written in Processing 3.3.7 to help visualise the problem. It allows the user to click on each tile to manually colour them either white or black, and to stop after a set number of iterations. See Figures 3 below.
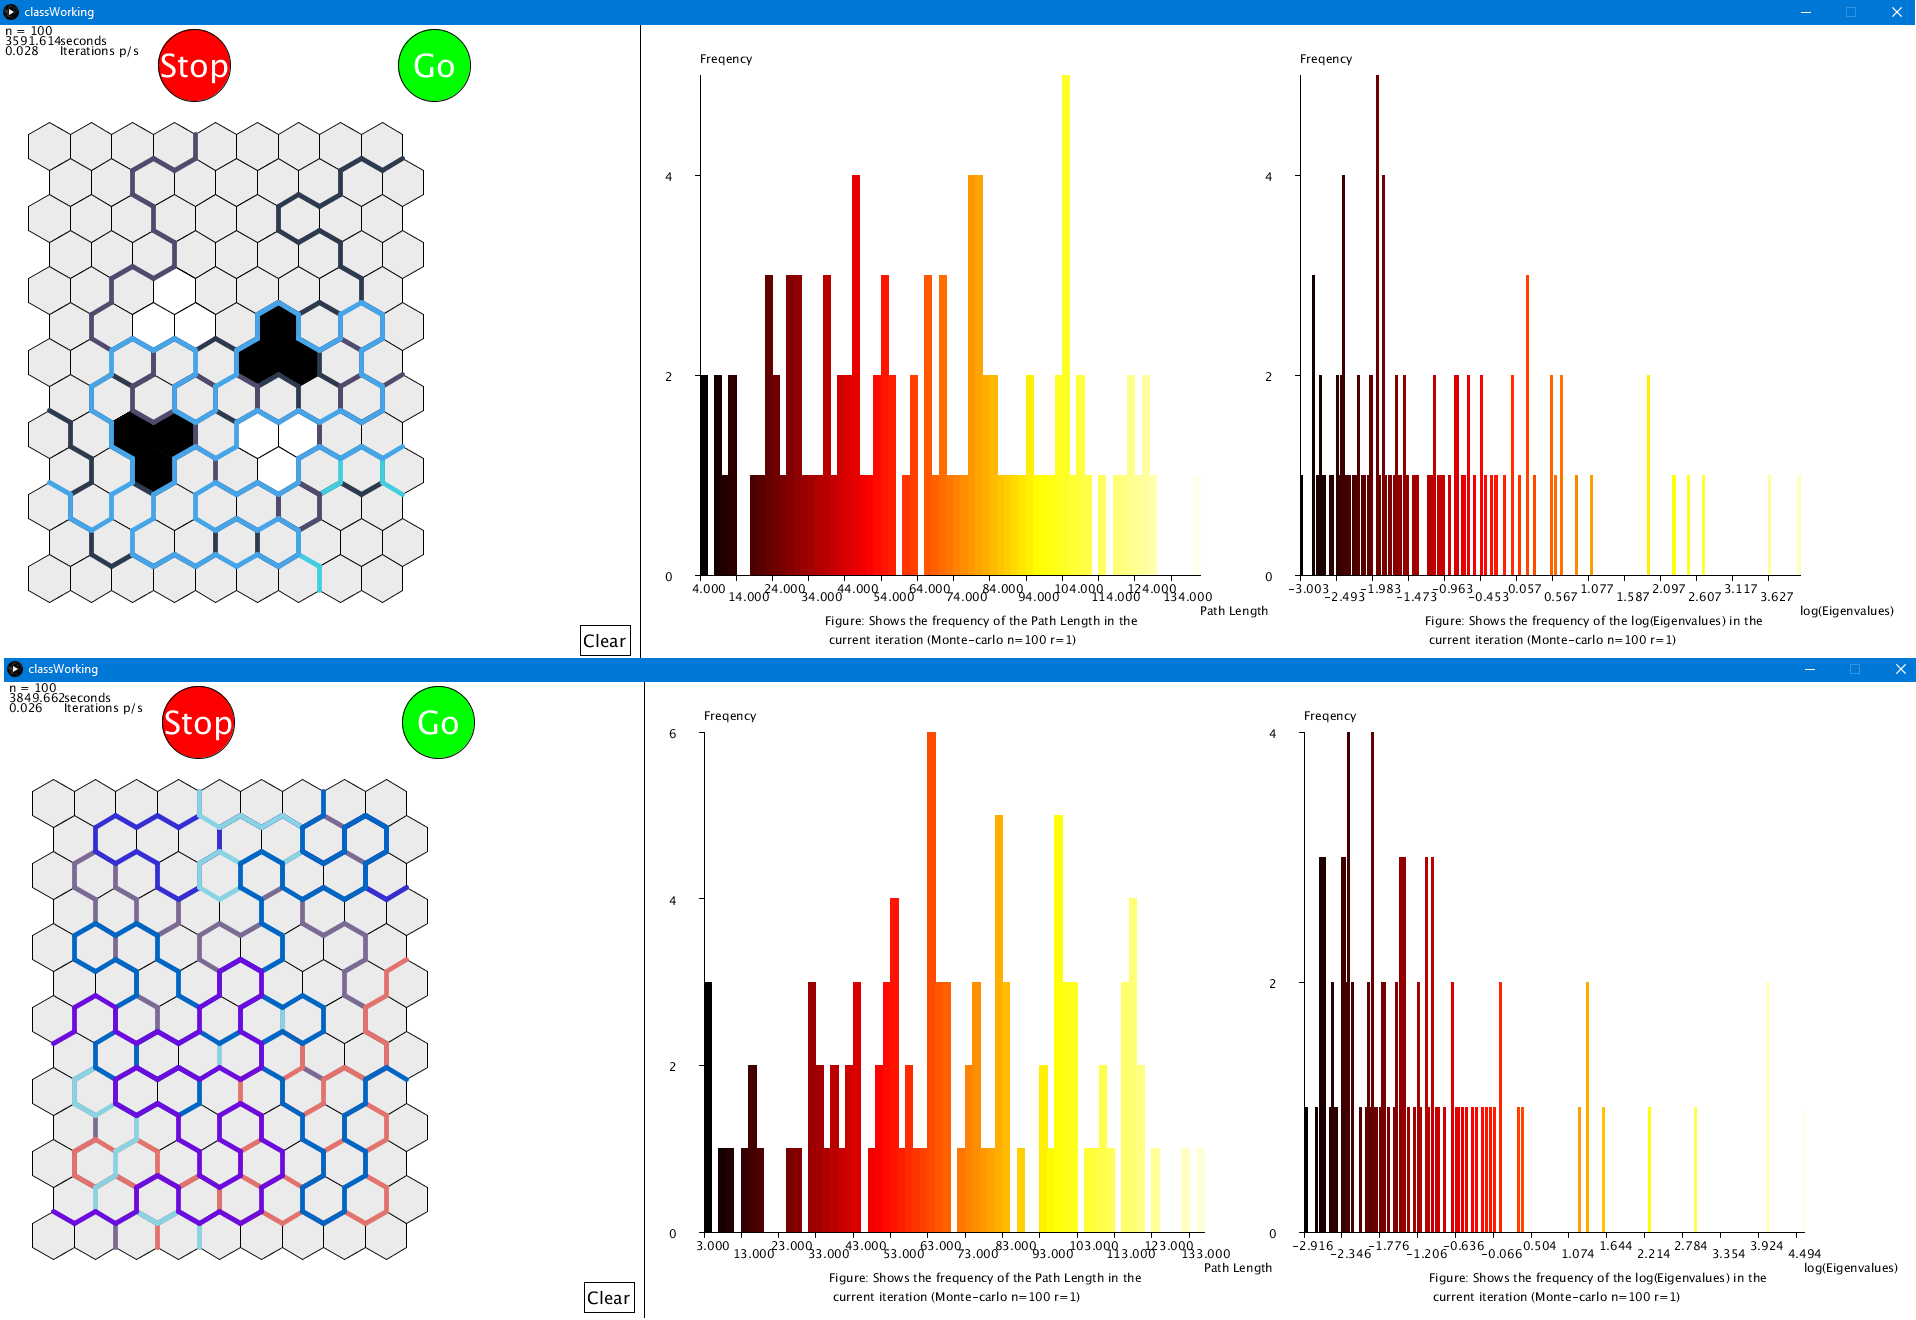
Unfortunately we determined that by the time it was structurally stable almost all of the edges would have a beam on them. And therefore would leave problems such as these to engineers. However, if someone does want to build a lattice in this way, we advise to use at least three \(SLE_6\) curves.